 Grafana配置ElasitcSearch监控-独立部署版本
# 如何使用Elasticsearch Exporter收集ElasticSearch集群数据
在现代数据系统中,监控是保障系统稳定性的重要环节。ElasticSearch作为一个广泛使用的搜索引擎,监控它的性能和状态至关重要。通过Prometheus结合elasticsearch-exporter,可以轻松收集ElasticSearch集群的各项数据指标,并进行监控。本文将详细介绍如何通过docker-compose部署elasticsearch-exporter并配置Prometheus以便收集ElasticSearch集群的监控数据。
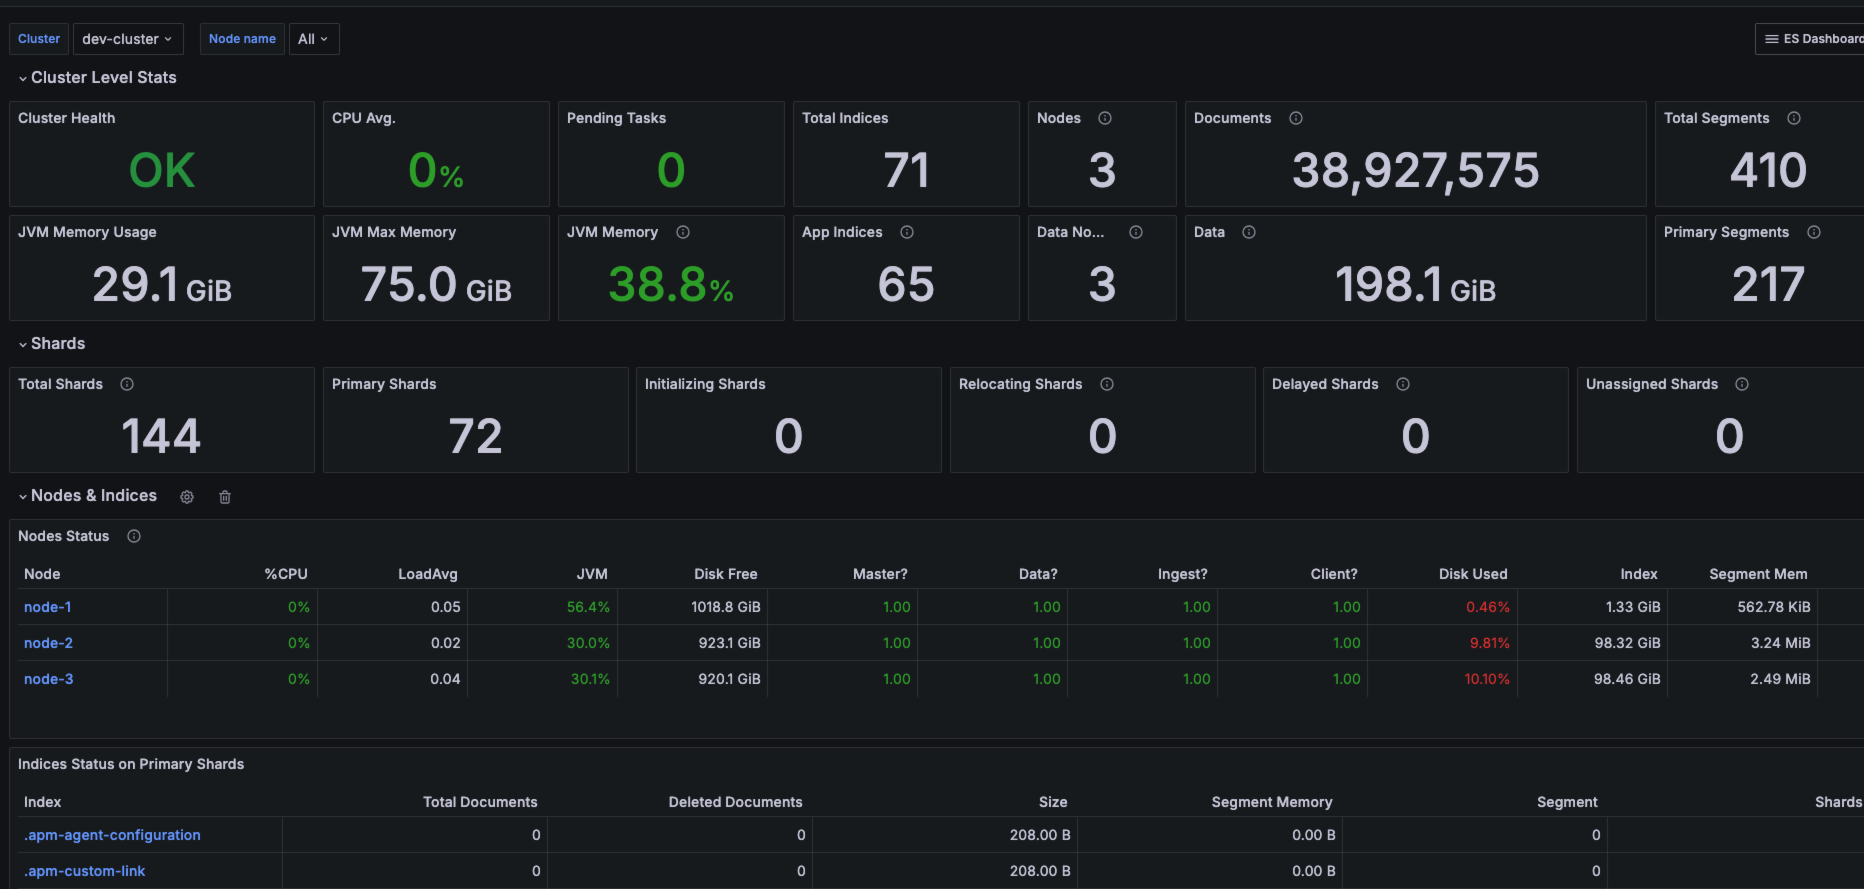
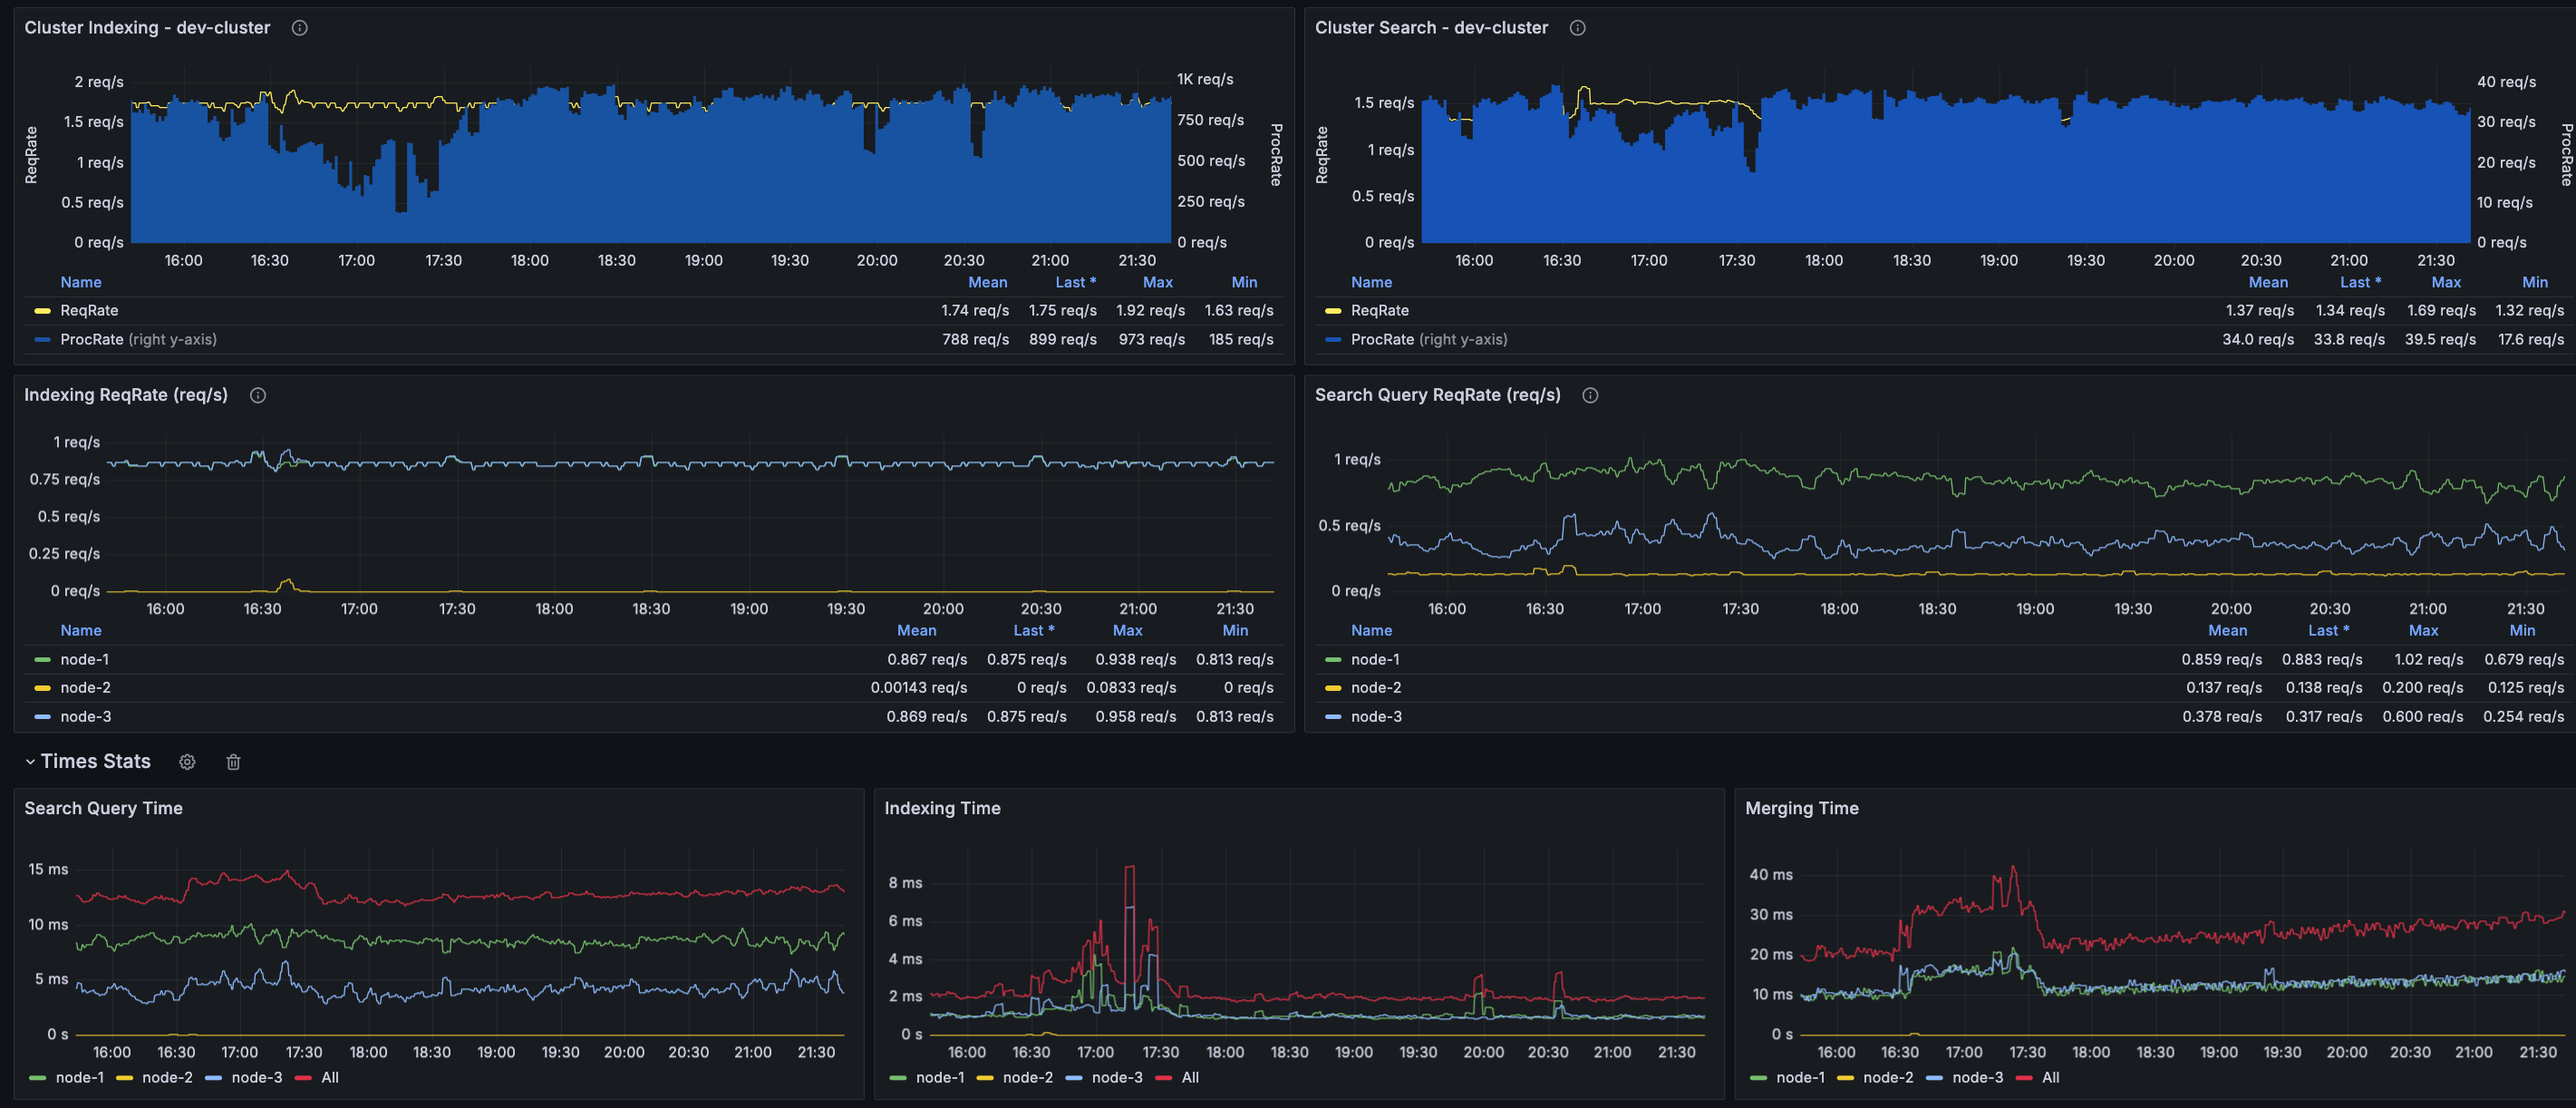
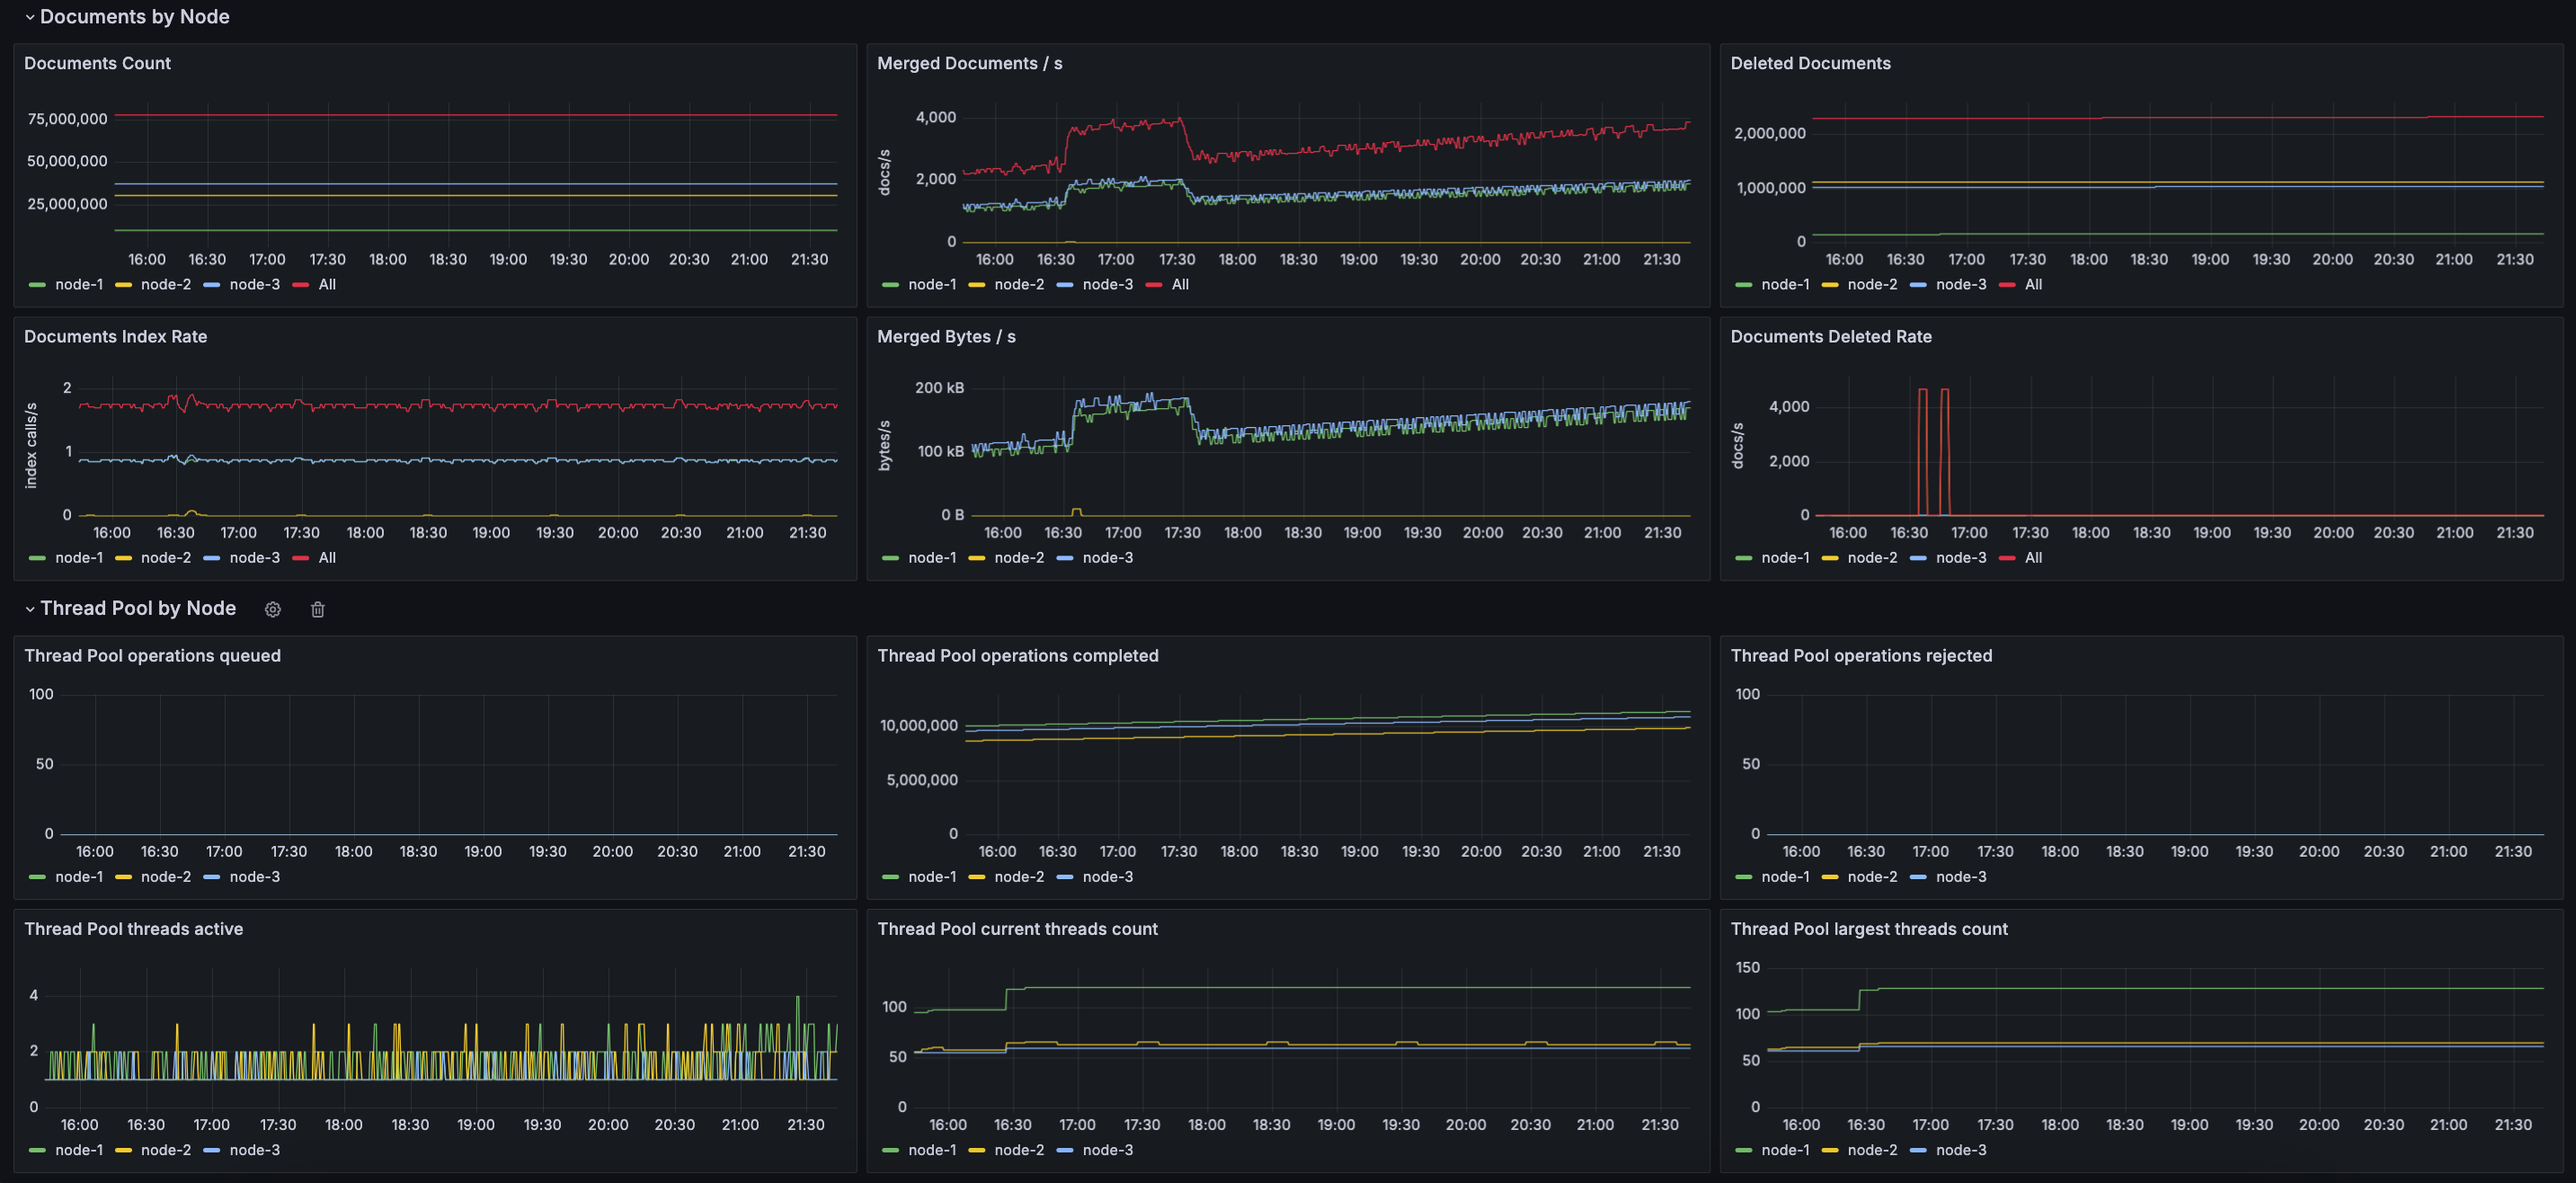
先看效果,几乎你想要的节点状态都包括:集群健康状态、节点状态、索引状态、搜索请求统计、查询缓存统计、合并操作统计、分片状态以及磁盘使用情况等等
# 一、配置elasticsearch-exporter
GitHub地址:https://github.com/prometheus-community/elasticsearch_exporter/releases
首先,我们使用docker-compose来启动两个elasticsearch-exporter实例,它们分别用于收集不同ElasticSearch集群节点的数据。以下是完整的docker-compose.yml配置:
version: '3'

services:
  elasticsearch_exporter1:
    image: quay.io/prometheuscommunity/elasticsearch-exporter:latest
    command:
     - '--es.uri=http://192.168.0.101:9200' # ElasticSearch集群节点1的地址
     - '--es.all' # 获取集群中所有节点状态
     - '--es.indices' # 查询集群中所有索引的统计信息
     - '--es.indices_settings' # 查询集群中所有索引的设置统计信息
     - '--es.indices_mappings' # 查询集群中所有索引映射的统计信息
     - '--es.shards' # 查询集群中所有分片的统计信息
     - '--es.timeout=20s' # 设置请求超时时间
    restart: always
    ports:
     - "192.168.0.200:9114:9114" # elasticsearch_exporter的外部暴露端口

  elasticsearch_exporter2:
    image: quay.io/prometheuscommunity/elasticsearch-exporter:latest
    command:
     - '--es.uri=http://192.168.0.102:9200' # ElasticSearch集群节点2的地址
     - '--es.all' # 获取集群中所有节点状态
     - '--es.indices' # 查询集群中所有索引的统计信息
     - '--es.indices_settings' # 查询集群中所有索引的设置统计信息
     - '--es.indices_mappings' # 查询集群中所有索引映射的统计信息
     - '--es.shards' # 查询集群中所有分片的统计信息
     - '--es.timeout=20s' # 设置请求超时时间
    restart: always
    ports:
     - "192.168.0.200:9115:9114" # elasticsearch_exporter的外部暴露端口
2
3
4
5
6
7
8
9
10
11
12
13
14
15
16
17
18
19
20
21
22
23
24
25
26
27
28
29
30
# 主要配置参数:
--es.uri: 指定ElasticSearch集群的地址。比如http://192.168.0.101:9200。--es.all: 通过这个参数可以抓取集群中所有节点的状态信息。如果不设置,只会获取配置的那个节点的信息。--es.indices: 抓取集群中的索引统计信息,包括索引数量、状态等。--es.shards: 抓取分片级别的统计信息。--es.timeout: 设定请求超时时间,避免因为响应延迟导致的数据抓取失败。
启动该docker-compose服务后,两个elasticsearch-exporter实例将分别运行,监听不同的端口以提供监控数据。
# 二、配置Prometheus收集数据
接下来,我们需要配置Prometheus来抓取从elasticsearch-exporter获取的监控数据。以下是prometheus.yml的示例配置:
global:
  scrape_interval:     5s # 全局抓取间隔
  evaluation_interval: 5s

scrape_configs:
  - job_name: 'prometheus' # Prometheus自带的默认抓取任务
    static_configs:
    - targets: ['192.168.0.200:9090'] # Prometheus自己的抓取地址

  - job_name: 'elasticsearch-dev' # 监控ElasticSearch开发环境的Job
    scrape_interval: 60s
    scrape_timeout:  30s
    metrics_path: "/metrics"
    static_configs:
    - targets: ['192.168.0.200:9114'] # elasticsearch_exporter1的地址

  - job_name: 'elasticsearch-prod' # 监控ElasticSearch生产环境的Job
    scrape_interval: 60s
    scrape_timeout:  30s
    metrics_path: "/metrics"
    static_configs:
    - targets: ['192.168.0.200:9115'] # elasticsearch_exporter2的地址
2
3
4
5
6
7
8
9
10
11
12
13
14
15
16
17
18
19
20
21
22
# 主要配置项:
scrape_interval: 定义Prometheus抓取目标数据的频率。通常可以设定为60秒,以避免过于频繁的请求对系统性能的影响。scrape_timeout: 设置每次抓取的超时时间,确保Prometheus在抓取时不会长时间等待目标的响应。metrics_path: 这是Prometheus抓取数据的默认路径,elasticsearch-exporter默认暴露的路径为/metrics。
# 启动
docker-compose up -d
启动该docker-compose服务后,两个elasticsearch-exporter实例将分别运行,监听不同的端口以提供监控数据。
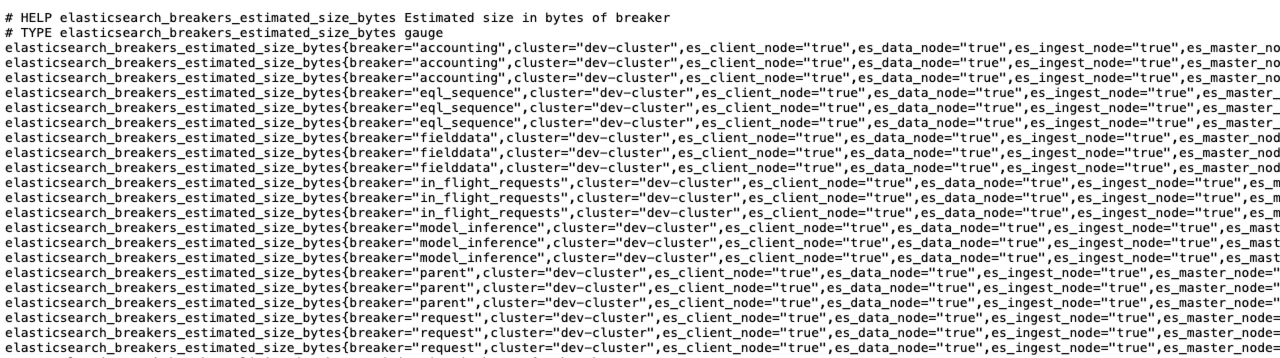
访问:http://192.168.0.200:9114/metrics 可以看到收集到的数据,如下
# 三、启动Prometheus
配置完成后,通过以下命令启动Prometheus实例:
docker run -d \
  --name=prometheus \
  -p 9090:9090 \
  -v /etc/prometheus.yml:/etc/prometheus/prometheus.yml \
  -v /data/prometheus_data:/prometheus \
  --restart always \
  prom/prometheus:latest
2
3
4
5
6
7
此命令使用Docker启动Prometheus,并映射配置文件和数据存储目录。在浏览器中访问http://<Prometheus_IP>:9090即可查看Prometheus的监控页面,并通过elasticsearch-exporter获取ElasticSearch集群的监控数据。
# 四、验证监控数据
启动Prometheus后,您可以通过Prometheus的web界面来验证是否成功收集到了ElasticSearch的监控数据。在/targets页面,可以看到所有已配置的elasticsearch-exporter实例是否为“UP”状态。如果状态为“UP”,说明Prometheus已经成功抓取了ElasticSearch的监控数据。
五、Grafana配置监控 官方模板:编号为2322
推荐模板:
13071: Dashboard for Elasticsearch Cluster Stats
13072: Dashboard for Elasticsearch Index Stats
13073: Dashboard for Elasticsearch Node Stats
13074: Dashboard for Elasticsearch History Stats
2
3
4
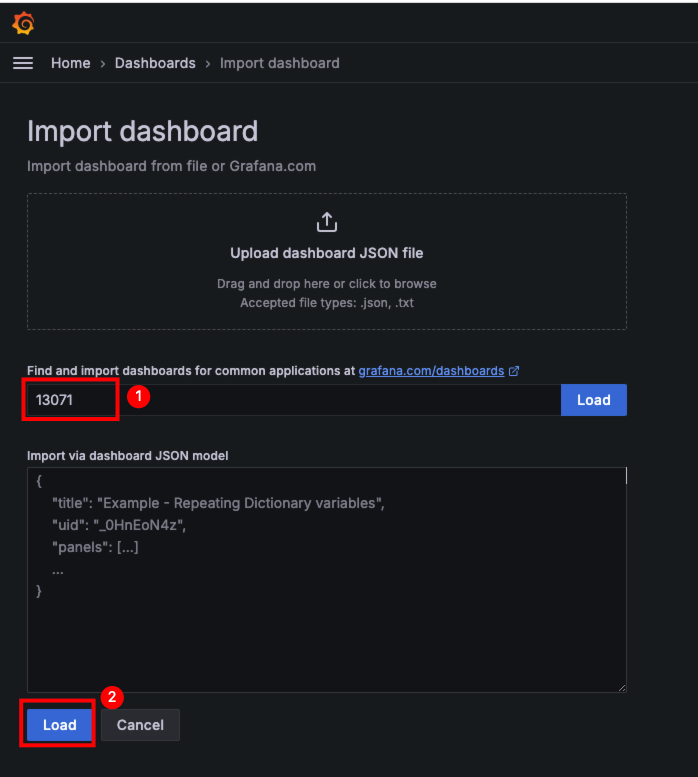
在Grafana中导入对应的模板编号,即可展示,这里推荐使用 13071
# 效果
# 总结
通过本文的介绍,我们了解了如何使用elasticsearch-exporter结合Prometheus来监控ElasticSearch集群的健康状态和性能数据。从下载elasticsearch-exporter,配置Prometheus,到成功收集并监控数据,我们涵盖了从头到尾的部署步骤。通过这种方式,可以轻松获取ElasticSearch集群的详细统计信息,包括节点状态、索引、分片等,帮助管理员及时了解系统运行情况并进行必要的调整。